I read a really interesting
article by Steve Treder yesterday at the Hardball Times, about the sudden HBP (that's Hit By Pitch, for you non-baseball people. Hi, honey!) explosion that nobody seems to have noticed, and it got me thinking. Apparently, batters are getting plunked at unprecedented rates. Pitchers today are hitting batters more frequently than
Don Drysdale and
Sal "The Barber" Maglie. Steve also cites a series of
very interesting articles by Dan Fox, which I frankly can no longer read because I have allowed my Baseball Prospectus subscription to expire*. Anyway, I remember reading 'em when they came out, sort of. They were good.
My basic theory is that HBP is a self-regulating system. When offense goes up, eventually batters start getting hit more frequently -- either by pitchers needing to pitch on the inside part of the plate and hitting guys by accident, or pitchers just saying "fuck it," and figuring that it's better to just go ahead and plunk Barry Bonds and put him on first rather than letting him hit -- until batters are so consistently getting backed off the plate (or taking first on an HBP) that batting levels start to drop. And then it starts all over again.
So, to figure out if I was on to anything, I had to do a couple things. Number one, I had to reconstruct Steve's HBP graph (which involved a lot of time on both
retrosheet.org and
baseball-reference.com) so I could screw around with the data, and compare the relative rates of HBP and slugging (a general measure of how hard batters are hitting the ball) and OPS (which correlates extremely well with overall scoring). That was a pain in the ass. Anyway.

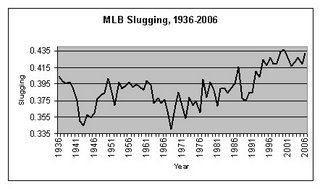
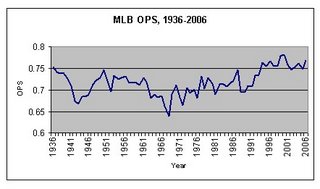
Wow, look at that -- batters really are getting hit more often. Huh. Anyway, take a look at OPS and Slugging over the same time period.


They look similar, yeah? If you look at the graph of HBP per Game, and the graphs of OPS and SLG, the shape of the graph is almost the same -- it starts out low, then there's a hump in the 60's before it starts taking off in the late 70's/early 80's -- but the HBP graph is a couple of years behind. Let's not forget that the pitchers who are hitting all of these batters are human. I don't imagine that Dontrelle Willis conjures up a batter's ISO power before he decides whether or not to plunk a guy in the ribs. But I do think that pitchers apply the lessons they learned last year to the batters they face this year.
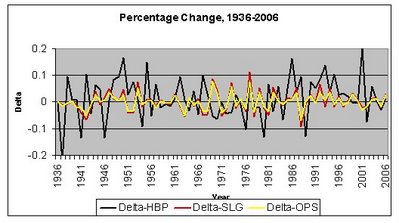
If you look at the graph of changes in HBP rate with the changes in SLG and OPS, they're kind of opposite. When the rate of hitting is going up, the rate of hit batsmen is going down, and vice versa. I wish I knew enough statistics to do a correlation, because it looks to me like HBP and offense are negatively correlated. But I'm not that smart. Anyway, here's a graph of the percentage of change in ML HBP, SLG, and OPS.

*
I allowed my Baseball Prospectus
subscription to expire on principle, because I refuse to pay for baseball analysis on the internet; especially when you can get so much great stuff for free. Look, I really like the BP site -- it's great; I have their book and everything. But if retrosheet.org is free, I just can't see my way clear to pay for Baseball Prospectus. I don't pay for ESPN Insider, either.
 Hooray! Still not dead! Also, pitchers and catchers have reported to St. Lucie. This day just keeps getting better and better!
 I also plotted this graph using a three-year linear moving average, to smooth out the curves and make the line a little less jumpy. Hopefully, that makes my point a little clearer, but mostly it's because I was bored.


